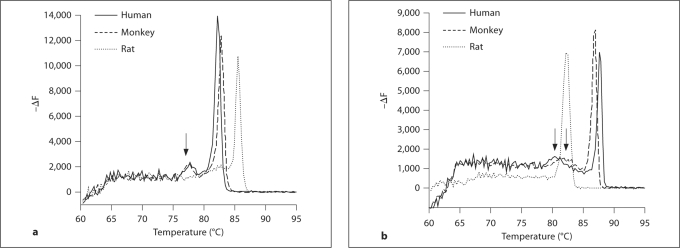
Fig. 3.
Multiple peaks in melting curves. A small secondary peak appeared in melting curves for MHC-neo (a) and MHC-beta (b) isoforms after qPCR of human, monkey and rat samples (arrows). The ratio of this secondary peak to the primary peak is independent of primer or template concentration or annealing temperature. Separation on a 2% agarose gel yields 1 product at the appropriate weight (see fig. 2), suggesting that the smaller peak likely represents a secondary structure within the sequence. ΔF = Change in fluorescence per change in temperature.

