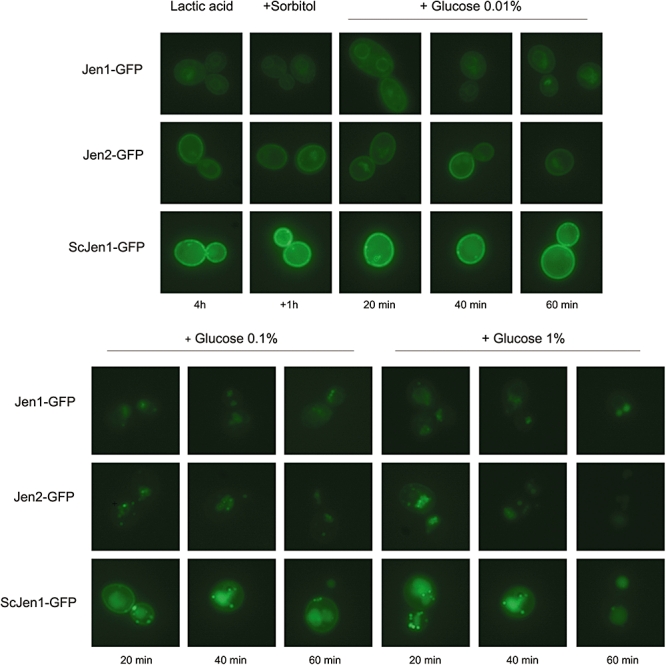
Fig. 5.

Timecourse of Jen1-GFP, Jen2-GFP and ScJen1-GFP inactivation at different glucose concentrations. Induced cells were treated with 0.01% (0.55 mM), 0.1% (5.5 mM) and 1% (55 mM) glucose or with sorbitol at the same concentrations (as a control for osmotic shock) and examined by fluorescence microscopy, after continued incubation: CPK20-5 (Candida albicans JEN1-GFP); CNV30-5 (C. albicans JEN2-GFP); BLC 491-U2 (Saccharomyces cerevisiae JEN1-GFP).
