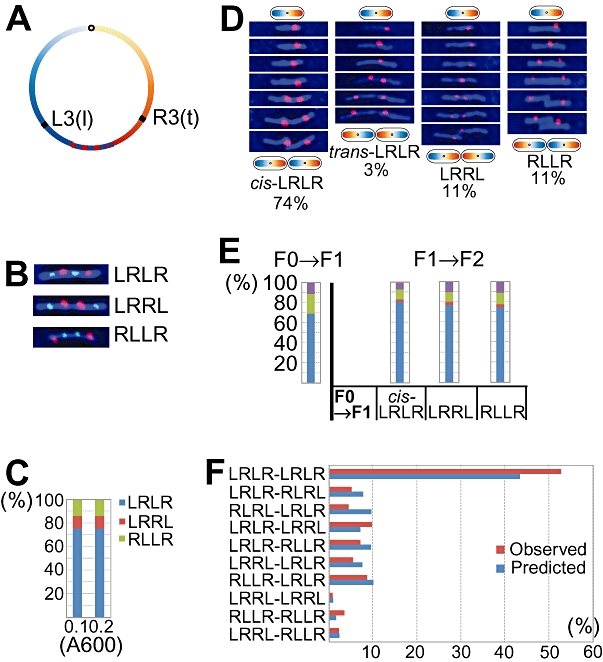
Fig. 2.

A. The genomic positions of L3 lacO and R3 tetO array loci. B. Snapshot images of cells adopting <LRLR>, <LRRL> or <RLLR> SCA. The L3 (or R3) foci are shown in green (or red). C. Proportions of cells with <LRLR> (blue), <LRRL> (red) or <RLLR> (green) SCA. Three experiments at different A600 are presented and ∼1000 cells were analysed for each experiment. D. Four time-lapse series (20 min interval) of F0→F1 cell generations adopting cis-<LRLR>, trans-<LRLR>, <LRRL> or <RLLR> SCA. The R3 foci are shown in red. The proportions of F0→F1 events adopting each SCA are shown at the bottom of each column. ∼3000 cell generations from 20 experiments were pooled and presented. E. Proportions of F0→F1 or F1→F2 events adopting cis-<LRLR> (blue), trans-<LRLR> (red), <LRRL> (green) or <RLLR> (purple) SCA. The first column shows the SCA proportions of the F0→F1 events (615 generations). The next three columns show the SCA proportions of the cis-<LRLR> (844 events), <LRRL> (240 events) or <RLLR> (142 events) F1→F2 groups. The trans-<LRLR> F1→F2 group was not included because it was too small (four events). F. Predicted and observed proportions of eight-focus (four sister chromosomes) cephalexin filaments. Predicted proportions are shown in blue (Supporting information) and observed proportions are shown in red.
