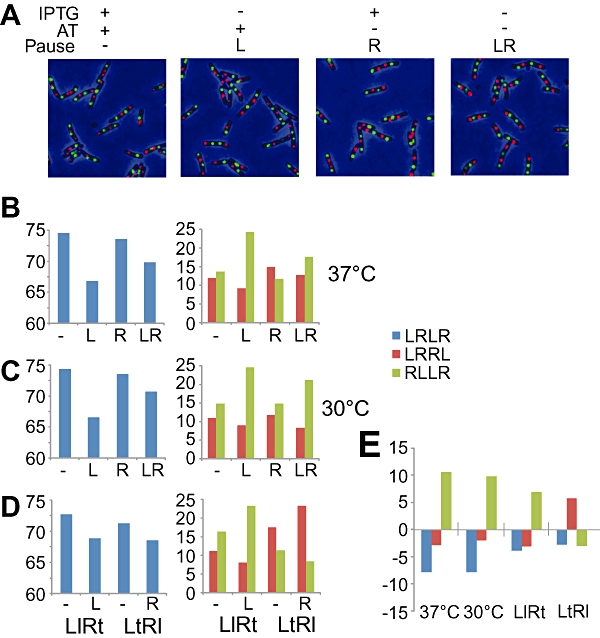
Fig. 3.

A. Snapshot images of cells growing in 37°C medium with the indicated combinations of inducers at saturating concentrations (IPTG: 0.5 mM, AT: 40 ng ml−1). ‘Pause’ refers to the replichore(s) affected by repressor-operator tight binding. The L3 foci are shown in green and the R3 foci in red. ∼2000 cells were analysed for each growth condition and the results are shown in Fig. 3B and C. B. The SCA proportions (cis-<LRLR> in blue, <LRRL> in red and <RLLR> in green) of cells with designated combinations of replichores affected by repressor-operator tight binding at 37°C. C. The SCA proportions of cells with designated combinations of replichores affected by repressor-operator tight binding at 30°C. D. The SCA proportions of L3lacO-R3tetO (‘LlRt’) or L3tetO-R3lacO (‘LtRl’) cells with designated combinations of replichores affected by repressor-operator tight binding at 37°C. E. Level and direction of changes in SCA proportions under the LacI-lacO tight binding condition when compared with corresponding ‘no tight binding’ reference values. The ‘37°C’ and ‘30°C’ columns are from Fig. 3B and C, showing the SCA proportion changes from ‘−’ to ‘L’ at 37°C and 30°C respectively. The ‘LlRt’ and ‘LtRl’ columns are from Fig. 3D, showing the SCA proportion changes from ‘−’ to ‘L′ and from ‘−’ to ‘R’, respectively, at 37°C.
