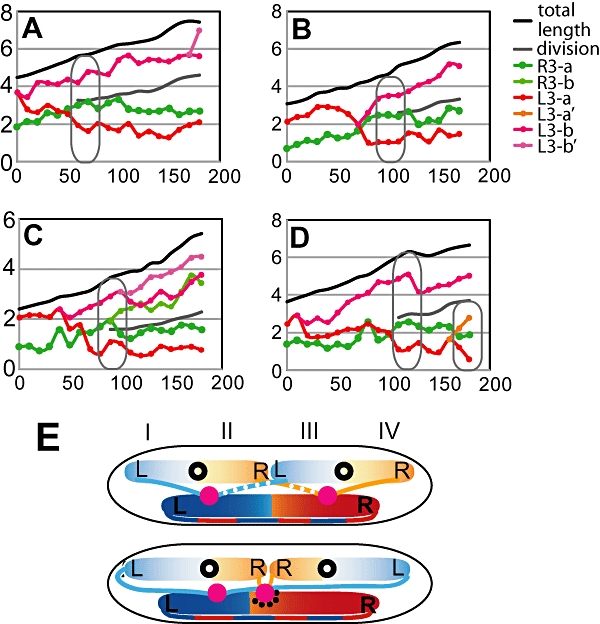
Fig. 4.

A–D. Time-lapse progressions showing L3-R3 loci after a replication block at R3. Replication block was applied to R3 (showed in green) by removing AT in M9 glycerol liquid culture for 60 min, while L3 (red and pink) could replicate as normal. The cells were then transferred to a slide mounted with the same medium plus 1% agarose. Pictures were taken every 10 min in a 3 h experiment. The schematics of cells (black cell-shaped outlines) are inserted to indicate the organization of loci in a cell of the indicated size. E. Schematic model for how replication directs chromosome organization. Replisomes are shown in pink. Leading and lagging strands are shown in smooth and dotted threads respectively. The replisome affected by pausing is marked with black dots. The whole cell is divided into four quarters marked by roman numbers. The upper cell adopts the cis-<LRLR> SCA, and the lower cell adopts the <LRRL> SCA.
