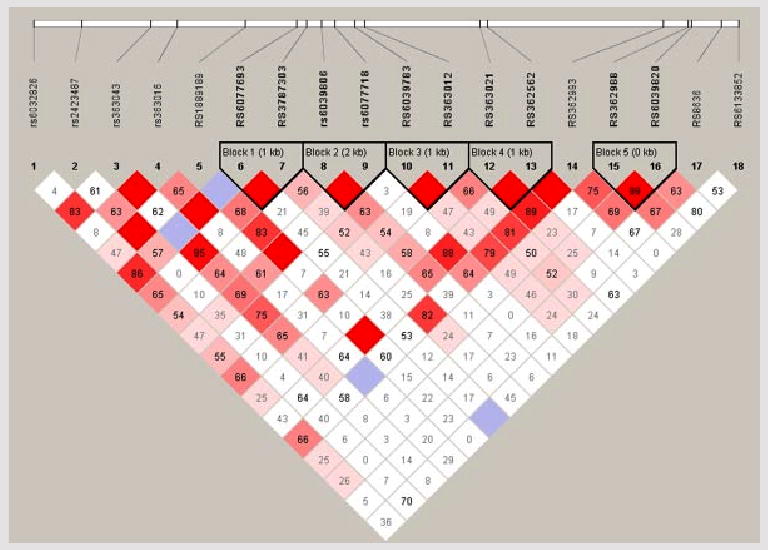
FIG. 1.

Intermarker linkage disequilibrium and haplotype blocks in SNAP25. Marker to marker LD, as well as haplotype blocks, in the SNAP25 gene as determined using haplotypes-tagging SNPs obtained from HapMap. Bright red represents D' = 1 and LOD ≥ 2, blue represents D' = 1 and LOD < 2, pink represents D' < 1 (figure displayed), and LOD ≥ 2, and white represents D' < 1 and LOD < 2.
