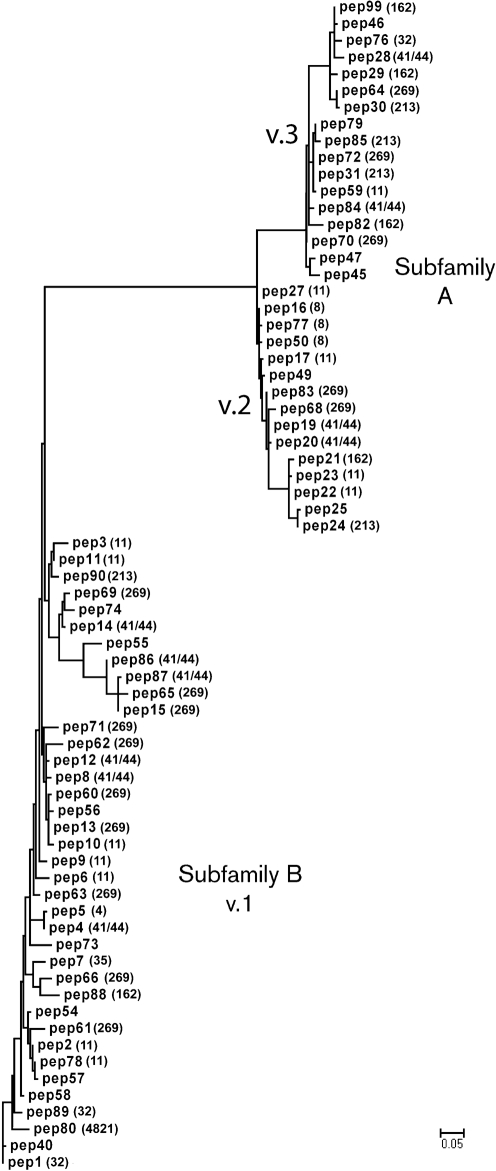
Fig. 1.
Phylogram of fHbp based on 70 unique amino acid sequences. For each sequence, the peptide identification number assigned in the fHbp peptide database at http://Neisseria.org is shown and, if known, the MLST clonal complex is shown in parentheses. The lower left branch shows variant group 1 as defined by Masignani et al. (2003) (subfamily B of Fletcher et al., 2004); subfamily A contained two branches, variant groups 2 and 3. The phylogram was constructed by multiple sequence alignment as described in Methods and Supplementary Table S2. Bar, five amino acid changes per 100 residues.

