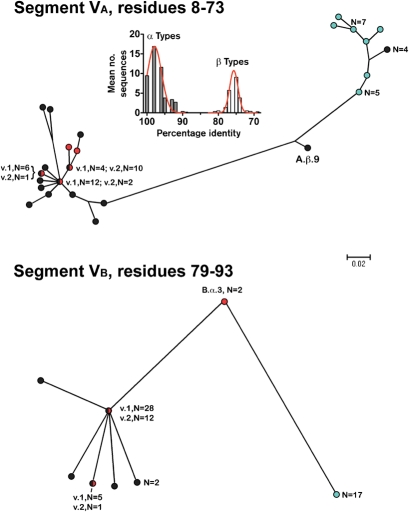
Fig. 3.
Phylograms of unique fHbp amino acid sequences in modular variable segments VA (residues 8–73) and VB (residues 79–93). Segments derived from fHbp in the variant group 1 are shown as black circles, the variant 2 group as red circles, and the variant 3 group as light-blue circles. Where multiple proteins possessed an identical sequence in a segment, the number of proteins is given. A.β.9 and B.α.3 refer to proteins with exceptional junctional points (see text). Bar, two amino acid changes per 100 residues. The histogram (Segment VA) shows the mean number of protein sequences (y axis) and percentage amino acid identity (x axis) generated by comparing each of the 48 α A segments with the corresponding α- and β-type A segments of all 70 proteins. The corresponding histograms comparing each of the α segments with the corresponding α and β types, and each of the β segments with the corresponding α and β types, for all five modular variable segments, VA to VE, are shown in Supplementary Fig. S1.

