
Fig. 3.
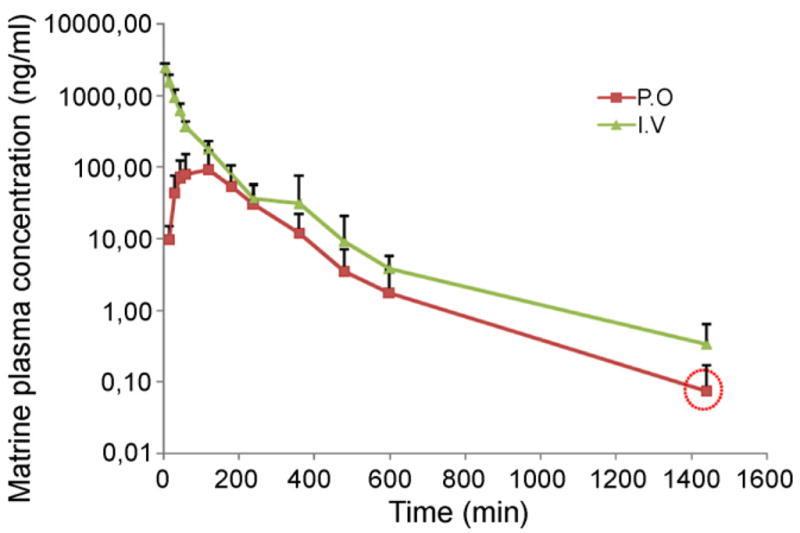
Plasma concentration–time curves of matrine after i.v. and p.o. administration of matrine (2 mg/kg). Each point represents an average of four determinations and the error bars are standard deviations of the mean. The point in the circle represents the average concentration, which is an approximate value since not all samples contained quantifiable matrine.