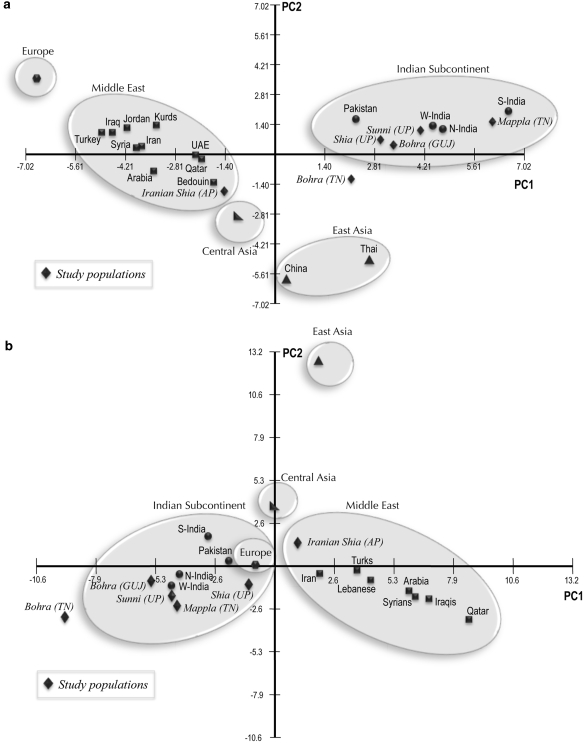
Figure 5.
(a) Principal component analysis plot based on mtDNA haplogroup frequencies. UP, Uttar Pradesh; GUJ, Gujarat; AP, Andhra Pradesh; TN, Tamil Nadu. Comparative data references: N-India, W-India and S-India (17–19); Pakistan (17); Middle East (20); Central Asia (13); East Asia (21–23); Europe (24). (b) Principal component analysis plot based on Y haplogroup frequencies. UP, Uttar Pradesh; GUJ, Gujarat; AP, Andhra Pradesh; TN, Tamil Nadu. Comparative data references: N-India, W-India and S-India (25–30); Pakistan (26); Middle East (12, 14, 31); Central Asia (32); East Asia (33); Europe (34).

