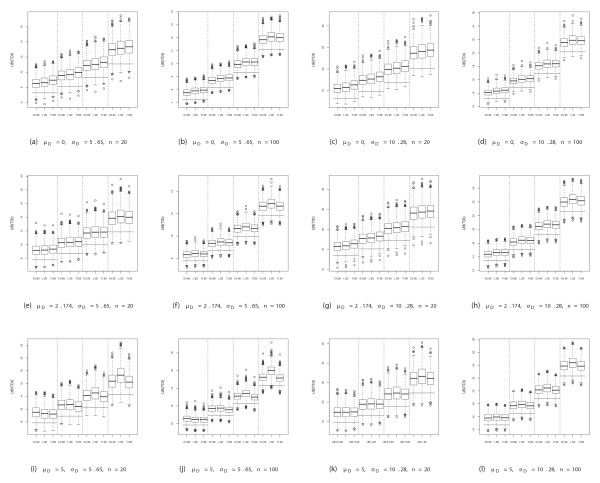
Figure 2.
Simulation results: upper bounds of the TDI estimates. Boxplots of the upper bounds of the TDI estimates (UB(TDI)) based on Choudhary (Ch), Lin (L) and our Tolerance Interval (TI) approaches for each of the scenarios considered. Horizontal lines refer to the actual TDI simulated based on the four different proportion sets (80%, 85%, 90% and 95%).

