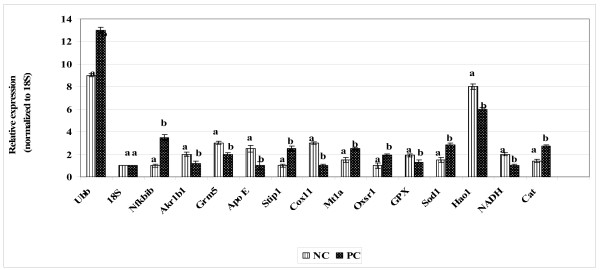
Figure 7.
Relative expression of 14 antioxidants and oxidative stress related genes in stressed and untreated rats (PC) and unstressed untreated rats (NC). Each value represents mean of 3 rats ± SD. Data was normalized with 18S gene. Within each gene Different alphabets indicate significant difference (P < 0.05).

