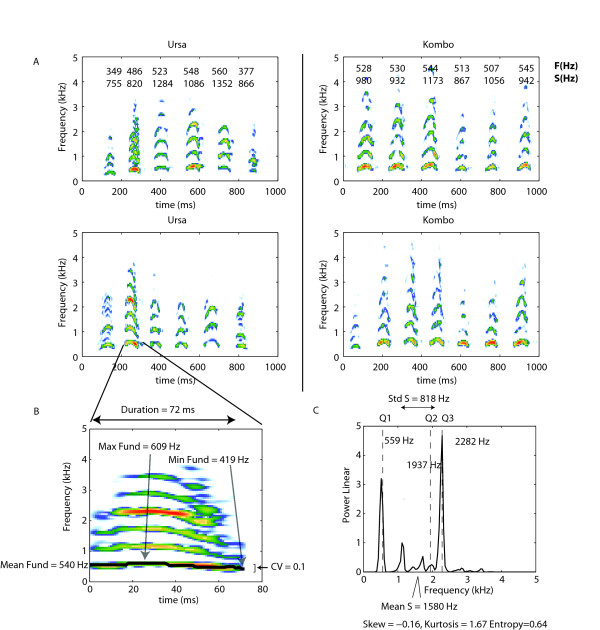
Figure 1.
Acoustic structure of the hyena's giggle (laughing) call. A. Two giggle bouts emitted by two different individuals (Ursa and Kombo). The mean fundamental F(Hz) and the spectrum mean S(HZ) for each giggle note is shown on top of its spectrographic representation for the giggle bouts in the first row. Ursa is a subordinate animal while Kombo is a dominant animal. Ursa is a 10 yr old female and Kombo is a 9 yr old female. They are both control animals (no hormonal treatment). The sounds of the giggle bouts for Ursa are available as Additional Files 1 and 2. The sounds of the giggle bouts for Kombo are available as Additional Files 3 and 4. B. Spectrogram of the second giggle note from the bout for Ursa shown in the lower panel. The fundamental frequency is underlined in black. From this time varying fundamental frequency, we extracted the mean, the minimum and maximum values as well as the coefficient of variation (CV). The values for this note are shown on the plot. C. Frequency spectrum of the giggle note shown in B. From the frequency spectrum, we obtained the mean frequency, standard deviation, skew, kurtosis, entropy and the three frequency values that delineate the quartiles in energy. The values for this note are shown on the plot (see main text for additional details about fundamental calculation and measurements of acoustic parameters)

