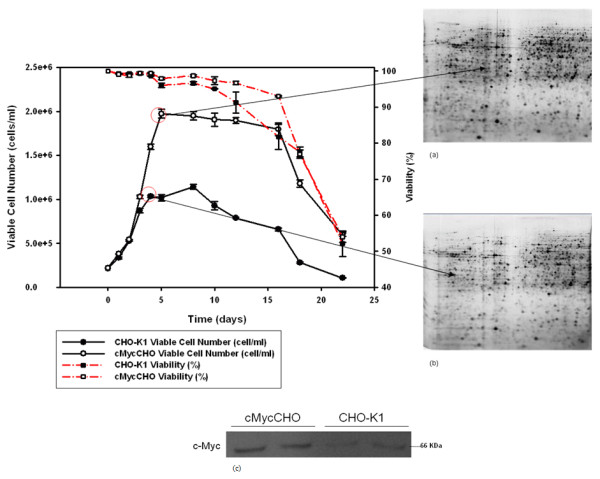
Figure 2.

Growth Curve and 2D gel sample points. The growth curve of cMycCHO (clear circles) compared to CHO-K1 (Black circles). This culture seeded and grown (n = 3) in parallel, cMycCHO (maximum cell density 1.9 × 10⁶ cells/ml) has an increased proliferation capacity compared to the CHO-K1 (maximum cell density 1.1 × 10⁶ cells/ml). The proteomic sampling was done at the late exponential phase to analyse the different proteins involved in developing this phenotype to produce (a) the representative proteome map of cMycCHO from 2D SDS-PAGE image scan and (b) the representative proteome map of CHO-K1 from 2D SDS-PAGE image scan from loading 100 μg of protein per gel. In visual comparisons, it can be recognised that the cMycCHO proteome map shows an overall increase in up-regulated protein expression due to cMyc activity at the late exponential phase of culture. The western (c) indicates a duplicate culture run with the inoculum to verify c-Myc over-expression.
