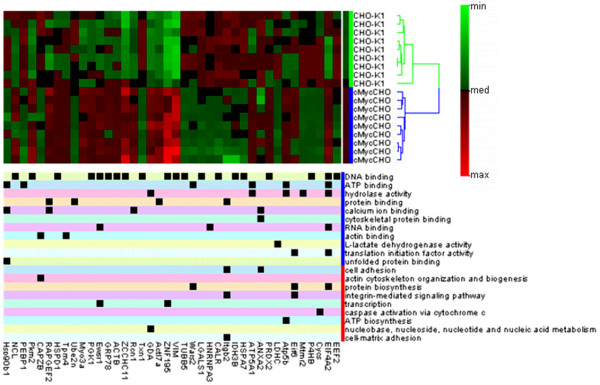
Figure 5.
The Heatmap illustrates the hierarchical clustering found in the replicate profile differentiating the two cell lines for the set of identified proteins found in the protein expression and the associated ontology of the proteins. The value range is defined by the minimum and maximum values in the entire dataset with zero being the medium value. The row dendigram displays the cluster of the proteome replicates with similar rows clustered together. Distances can be roughly determined by the height of the node that binds the replicates together, all technical replicates were found to be alongside each other making the start of each biological replicate 1st, 4th, 7th in line. One replicate in the CHO-K1 dataset showed the most variation from the dataset but was still within the CHO-K1 node. The ontology indicated that the c-Myc had affected a large range of molecular pathways and from the identified dataset blue indicates cellular processes affected and red indicates molecular function affected.

