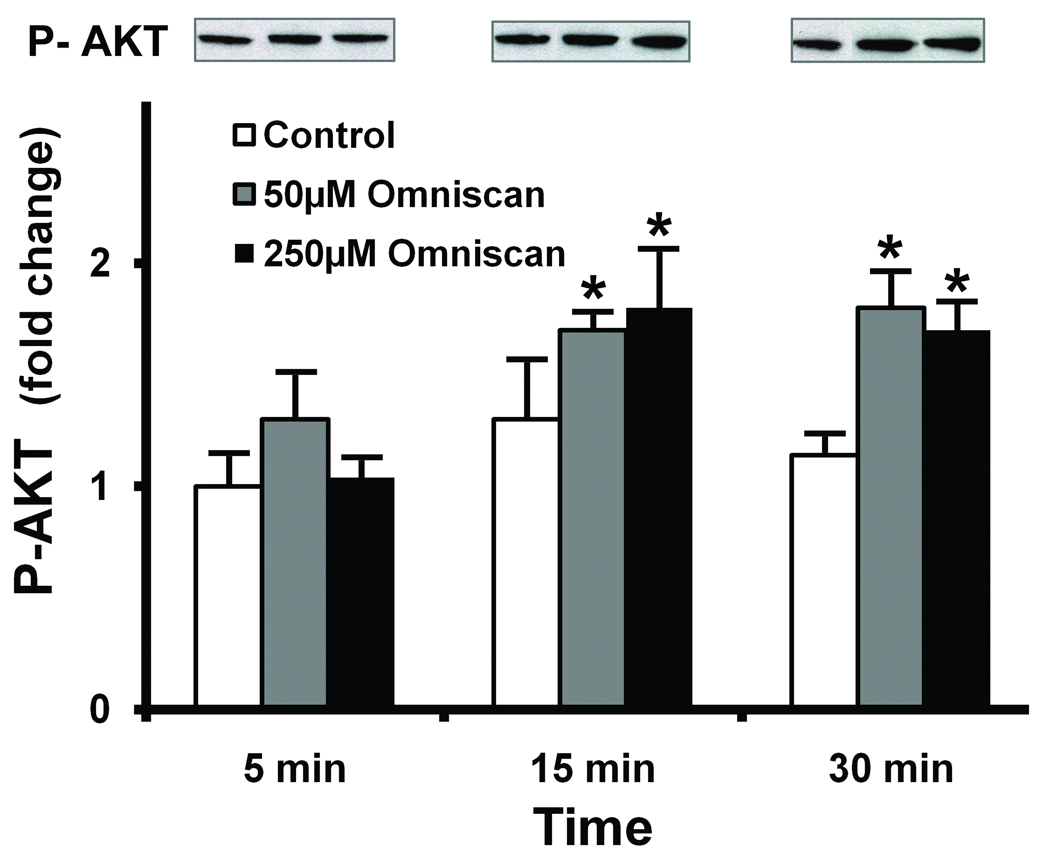
Figure 3. AKT phosphorylation in Omniscan-treated cells.
Cells were incubated under control conditions or in the presence of Omniscan for the indicated times. At the end of the incubation period, cell lysates were prepared and assayed for phosphor-AKT and total AKT protein by western blotting. Western blots were scanned, digitized, and quantified. Values shown are means and standard errors based on n=3 separate experiments. The insert shows phosphor-AKT and total-AKT from one of the replicate experiments. Statistical significance of the data was assessed by ANOVA, followed by paired-group comparisons. *indicates statistically significant increase compared to the respective control value at p<0.05 level.

