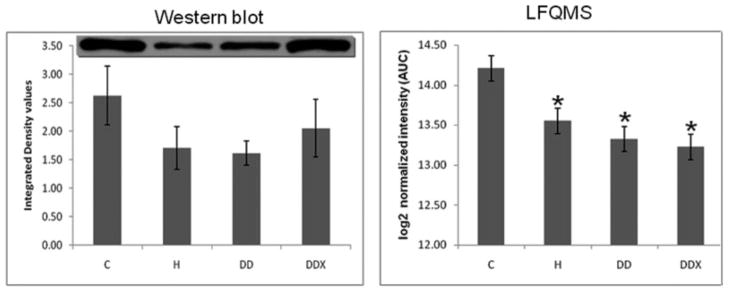
Figure 8.
Adiponectin in LDL. (Left) Results of a Western blot analysis (n = 3) revealed no significant decreases of adiponectin in LDL with any treatment groups. The anti-adiponectin antibody reacted with two bands as shown at the top of the bar graph. (Right) Results of LFQMS analysis (n = 4) revealed significant decreases in adiponectin with in all groups on an atherogenic diet (H, DD, DDX) compared to control. * Denotes a significant difference compared to control (C) animals (p ≤0.05).

