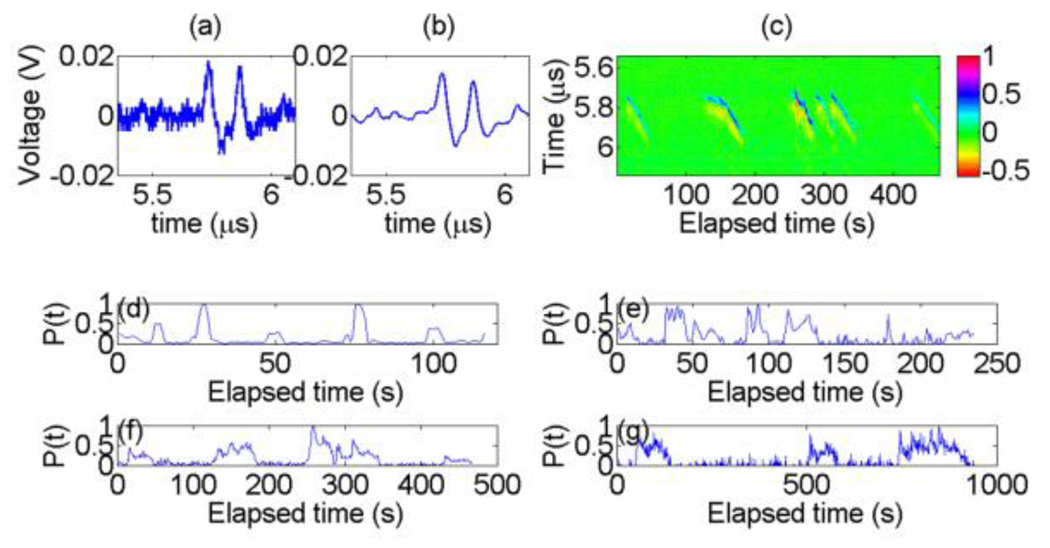
Figure 2.
(Color online) (a) Detected raw PA signals at a calibrated flow speed of 33 µm/s and at elapsed time = 309.1 s. (b) Signals after filtering. (c) Detected PA signals as a function of elapsed time, measured at the calibrated speed of 33 µm/s. The average distance from the beads to the detector was ~8.5 mm. (d)–(g) PACS strength fluctuation as a function of elapsed time. PACS strengths in (d)–(g) correspond to calibrated speeds of 200, 90, 33, and 14 µm/s, respectively.

