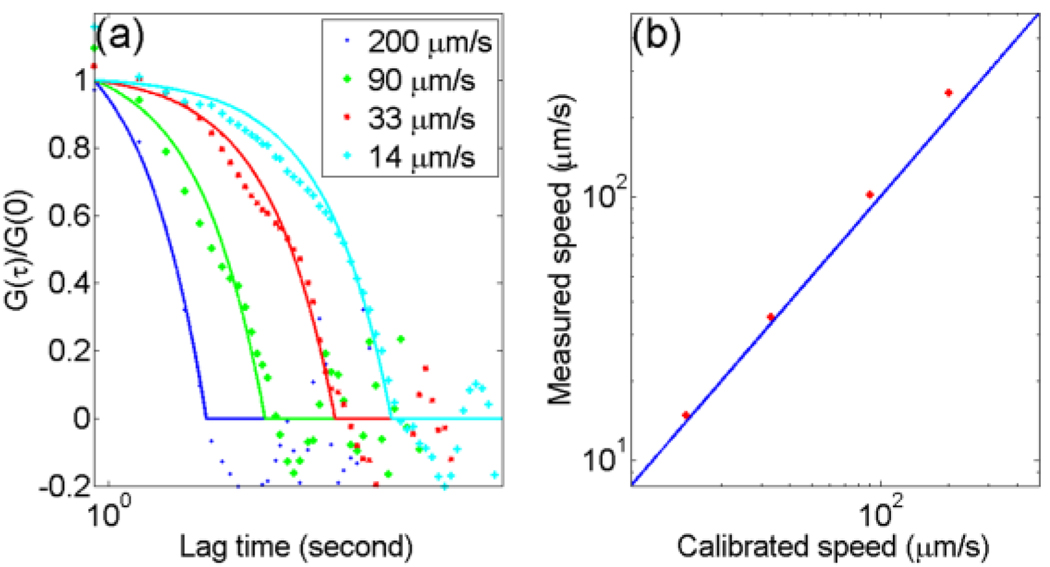
Figure 3.
(Color online) (a) PACS curves of designed flow speeds of 200, 90, 33, and 14 µm/s. The solid curves are the corresponding fits. (b) The measured flow speeds by the PACS technique, shown in stars, versus the calibrated flow speeds. The solid line represents the results from direct measurement.

