Fig. 1.

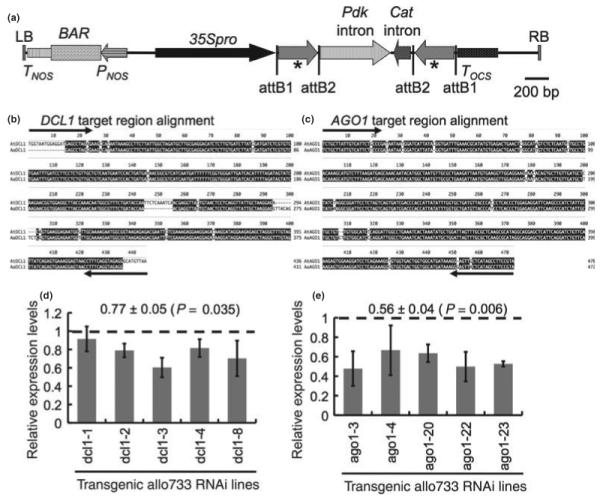
Hairpin RNA constructs for DCL1 and AGO1 and downregulation of DCL1 and AGO1 in transgenic plants. (a) Schematic diagram of T-DNA region of the hairpin RNA construct in pAGRIKOLA (Hilson et al., 2004). The hairpin RNA cassette was produced using partial cDNA fragments of DCL1 (436 bp) or AGO1 (470 bp) that was cloned into the T-DNA region flanking the Pdk and Cat introns using Gateway cloning vector. 35Spro, cauliflower mosaic virus 35S promoter; attB1 and attB2, recombination attachment sites from Gateway cloning vector; BAR, bialaphos resistance gene; Cat, intron of the castor bean Cat gene; LB, left border; Pdk, 2nd intron of the Flaveria Pdk gene; PNOS, nopaline synthase promoter; RB, right border; TNOS, nopaline synthase terminator; TOCS, octopine synthase terminator. Asterisks indicate the DCL1 or AGO1 partial cDNA fragments in the sense and antisense orientation. (b,c) clustal w alignment of target AtDCL1 (b) or AtAGO1 (c) fragment used in the RNAi construct with the corresponding bacterial artificial chromosome (BAC) sequence from Arabidopsis arenosa. Arrows show the primer binding sites in generating the hairpin constructs. (d,e) quantitative reverse transcriptase polymerase chain reaction (qRT-PCR) showing downregulation of DCL1 and AGO1 transcripts in dcl1(Allo):RNAi lines (d) and ago1(Allo):RNAi lines (e) compared with the average expression level of the corresponding transcripts in two control transgenic lines containing a plasmid vector only (dashed line). Relative expression levels were estimated using Ubiquitin10 gene as an internal control. Values at top indicate the mean ± SE and P-value of target transcript reduction in the RNAi lines compared with the control transgenic lines. Error bars indicate standard deviation from replicated experiments.
