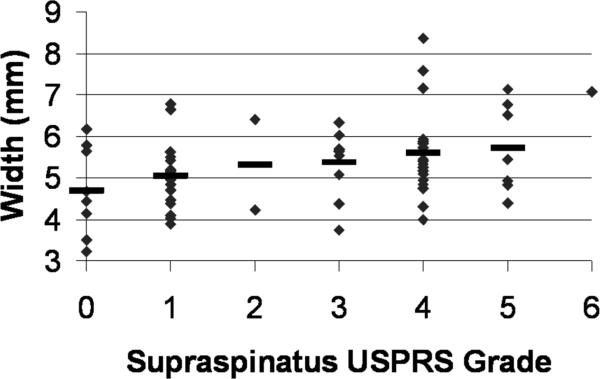
Figure 3.
Box-plots showing the median and quartiles of raw quantitative ultrasound descriptors of biceps tendon appearance vs. biceps grade from the clinical ultrasound examination. Only 1 subject had a biceps grade of 3, and his data is represented as a single line for reference only. This subject's data was combined with the Biceps Grade = 2 group for statistical analyses. Post-hoc significant differences, when controlling for tendon depth below the skin, are noted as * (p < .05) or † (0.05 ≤ p < 0.10).

