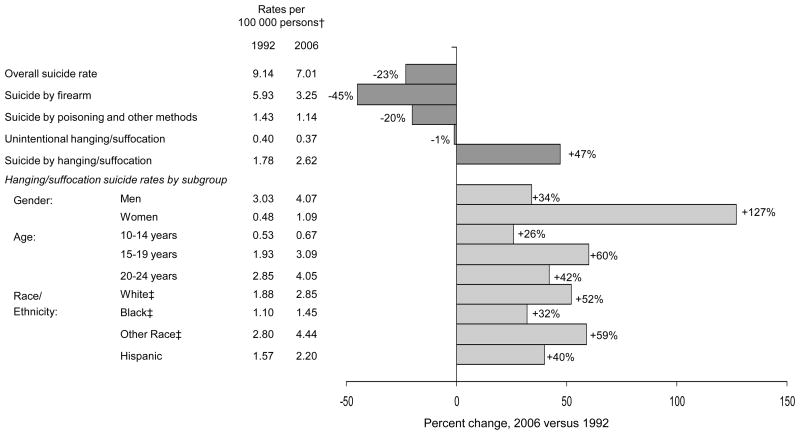
FIGURE 1. Percent Change in Rates of Suicide by Method and Rates of Unintentional Hanging/Suffocation in 2006 vs. 1992 for Persons Aged 10 to 24 Years in the United States*.
*All method-specific linear trends based on the negative binomial regression analysis are significant at P<.01 except for the trend in unintentional hanging/suffocation, which was not significant (P>.10).
†For ease of interpretation, crude rates per 100 000 persons are presented using only 1992 and 2006 data points.
‡Non-Hispanic.

