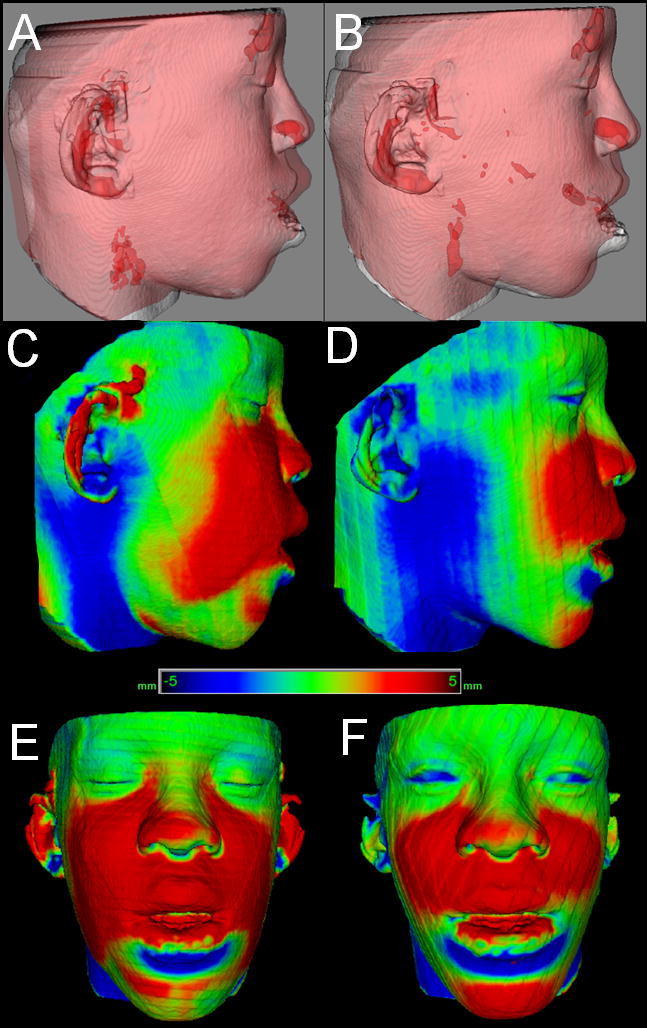
Figure 8.

Difference in assessment of soft tissue changes 1 week and 6 weeks after maxillary advancement and mandibular subapical osteotomy. A–B, Transparency overlays. A, Superimposition of pre-surgery (white) and 1 week post-surgery (red). B, Superimposition of pre-surgery (white) and 6 weeks post-surgery (red). C–F, Surface distance color maps of A and B superimpositions. C–D, Lateral views. E–F, Frontal views. Note 1 week post-surgery swelling and that blue surface distances at the neck are artifacts due to differences in cervical positioning between 1 week and 6 week 3D imaging acquisitions.
