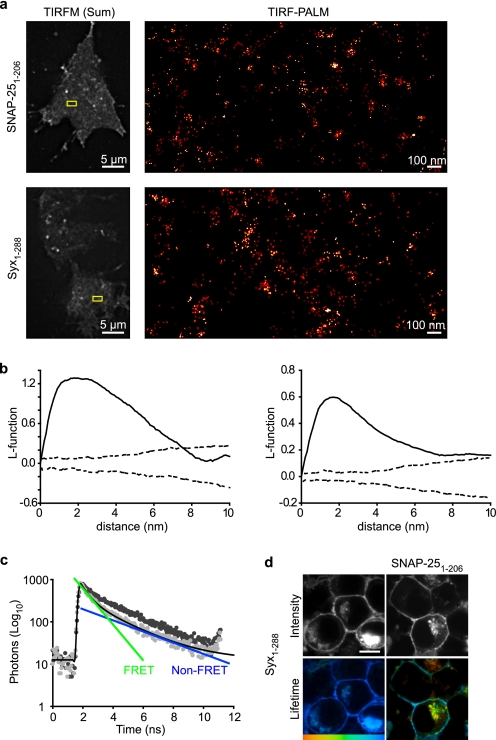
FIGURE 1.
Syntaxin and SNAP-25 molecules interact in clusters on the plasma membrane. a, TIRF-PALM localization map showing single molecules of SNAP-25 and syntaxin (Syx-(1–288)) on the plasma membrane. The boxed area highlighted in the summed total internal reflection fluorescence microscopy image (left panels) is zoomed in the TIRF-PALM-rendered image (right panels), where molecular clustering is clearly visible. b, L-function is a commonly used transformation of Ripley's K function and transforms spatially random data into a straight line. Representative L-function plots are shown for syntaxin (right) and SNAP-25 (left). Each representative dataset, consisting of XY coordinates describing the precise localization of individual t-SNARE molecules, was repeatedly randomized, and the L-function was re-derived. Confidence envelopes showing the maximum and minimum L-function values from 1000 randomizations are shown (dashed line). This approach thus compares the L-function between experimental data and an identical number and density of random points. Values above the confidence envelopes indicate nonrandom spatial organization. c, TCSPC-FLIM analysis confirmed that a syntaxin fluorescent donor (cerulean-syntaxin) followed a single fluorescence decay (dark gray). In the presence of a proximal acceptor (EYFP-SNAP-25), this decay was described by a bi-exponential decay (light gray). The time constants of the bi-exponential functions correspond to a short FRET lifetime (green) and a longer fluorescence lifetime identical to the non-FRET control (blue). Both the FRET and non-FRET components are present in every region of the cell in varying proportions. d, TCSPC-FLIM of a cell containing cerulean-syntaxin alone (left panels) or in the presence of EYFP-SNAP-25 (right panels) showing intensity (gray scale) and lifetime on a color scale from 1250 to 2250 ps. The lifetime of syntaxin is shortened in the presence of SNAP-25 indicating an interaction. All scale bars are 5 μm unless otherwise stated.

