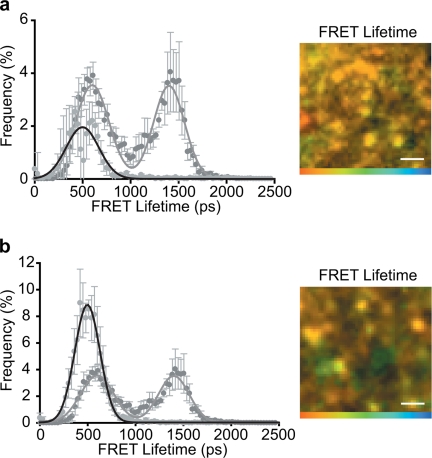
FIGURE 3.
Two t-SNARE conformations are a result of differential SNAP-25 engagement. a, truncation of the C terminus of SNAP-25 to mimic BoNT/E cleavage (SNAP-25-(1–181)) abolished the state 2 conformation as shown in the histogram of FRET lifetimes (left panel) resulting in a largely uniform spatial distribution of FRET lifetimes (right panel) with a lifetime corresponding to the state 1 conformation. b, truncation of the entire C-terminal helix of SNAP-25 (SNAP-25-(1–120)) also abolished the state 2 conformation (left panel) resulting in a more uniform spatial distribution of FRET lifetimes (right panel). All color scales: 0–2000 ps. All scale bars 1 μm unless otherwise stated. Graphs show means ± S.E., n = at least five independent experiments.

