FIGURE 3.
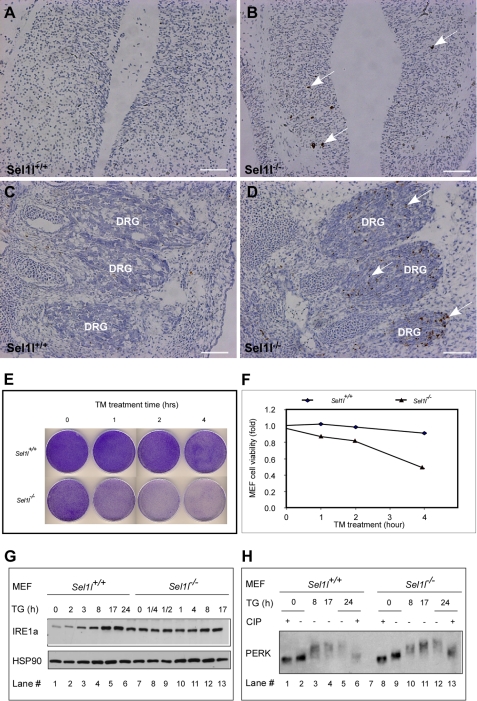
SEL1L deficiency induces apoptosis in vivo and predisposes MEF cells to ER stress-inducing reagents. A–D, increased apoptosis in Sel1l−/− embryos. Forebrain (A and B) and dorsal root ganglion (DRG) region sections (C and D) from Sel1l+/+ and Sel1l−/− embryos at E12.5 were assayed by TUNEL. Apoptotic cells are indicated by arrows. E, representative images of crystal violet staining of tunicamycin-treated MEF cells. Sel1l+/+ and Sel1l−/− MEF cells in 10-cm dishes were treated with 2 μg/ml of TM for the indicated periods, trypsinized, and re-plated (1 × 10⁴ cells/per well) into 10-cm dishes. Five days later, the resulting cells were stained with crystal violet. F, quantification of MEF cell viabilities before and after TM treatment. Crystal violet-stained MEF cells in E were solubilized with 600 ml of 1% SDS, and absorbance of the resulting solution was measured at 570 nm. Relative cell viability was calculated as a percentage of absorbance of TM non-treated cells. G, Western blot analysis of IRE1a expression in Sel1l+/+ and Sel1l−/− MEFs. Sel1l+/+ and Sel1l−/− MEFs were treated with TG for the indicated periods. IRE1a and HSP90 (loading control) expression were analyzed by immunoblotting. Note that Sel1l−/− MEF has a noticeably higher basal level IRE1a expression than Sel1l+/+ MEF (lane 7 versus 1). H, Western blot analysis of PERK phosphorylation. Sel1l+/+ and Sel1l−/− MEFs were treated with TG for the indicated periods in the presence or absence of calf intestinal alkaline phosphatase (CIP). Lysates of the treated cells were blotted and probed with PERK antibody.

