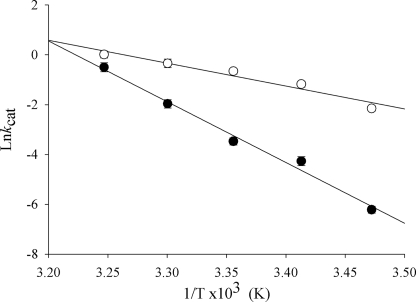
FIGURE 5.
The thermal dependence of the SS2 variant-catalyzed reaction. kcat values were calculated by performing steady state kinetics at different temperatures. A, an Arrhenius plot depicting the difference between the wild-type (●) and the SS2 variant-catalyzed (○) reactions at 288, 293, 298, 303, and 308 K. The error bars are plotted over and partially obscured by the data points.

