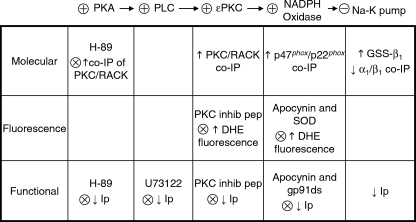
FIGURE 7.
Summary of molecular, fluorescence, and patch clamp studies on effects of forskolin. Steps in the signaling pathway that are implicated are shown at the top with stimulation and inhibition indicated by + and −. Blocks of responses to forskolin are indicated below by ×. Glutathionylation of the β1 subunit is indicated by GSS-β1, and Na+-K+ pump current is indicated by Ip. co-IP, co-immunoprecipitation.

