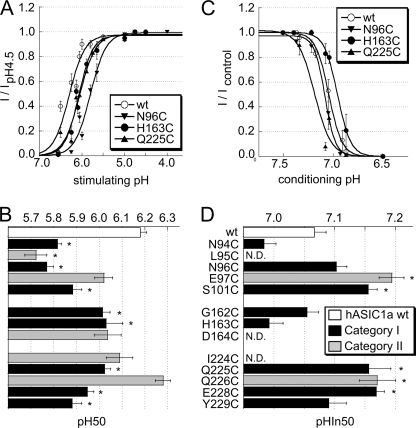
FIGURE 5.
pH dependence of ASIC1a activation and SSIN. A, pH dependence of activation of ASIC1a WT (○) and the mutants N96C (▾), H163C (●), and Q225C (▴) (n = 7–14). Currents were normalized to the peak current measured at pH 4.5. The lines represent fits to the Hill equation (see “Experimental Procedures”). B, pH of half-maximal activation pH 50 of ASIC1a WT and mutants, n = 3–14. *, pH 50 different from WT pH 50, p < 0.05 (ANOVA and Dunnett post hoc test). The y axis labeling on B is identical to that of D. C, pH dependence of SSIN of ASIC1a WT (○) and the mutants N96C (▾), H163C (●), and Q225C (▴) (n = 6–12). Currents were induced by a 5-s acidification to pH 4.5 after exposure for 55 s to the conditioning pH. The current normalized to the condition with the most alkaline conditioning pH is plotted as a function of the conditioning pH. D, pH for half-maximal inactivation (pHIn50) of ASIC1a WT and mutants, n = 4–16. *, pHIn50 different from that of WT, p < 0.05 (ANOVA and Dunnett post hoc test), N.D., not determined. Data are presented as mean ± S.E.

