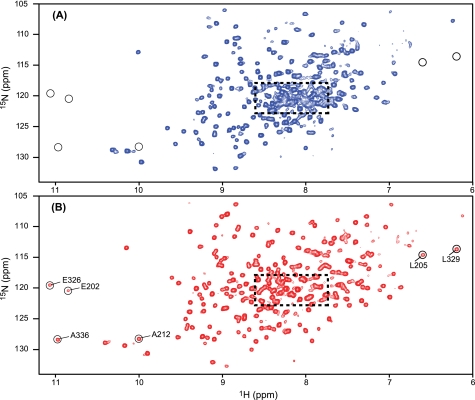
FIGURE 2.
1H-15N TROSY-HSQC spectra of RIα-(98–381). The 1H-15N TROSY-HSQC spectra were recorded on 50 μm U-2H/13C/15N-labeled RIα-(98–381) in the absence (A) and presence (B) of 200 μm cAMP. Several resonances that are only observed in the cAMP-bound RIα-(98–381) sample (B) are circled and labeled with residue name and number.

