
Figure 1.
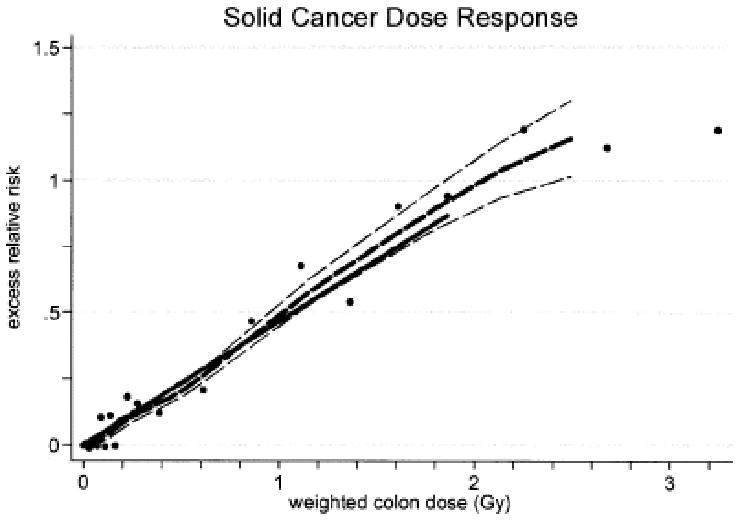
Solid cancer dose-response function based on A-bomb survivor cancer incidence data. The thick solid line is the fitted linear gender-averaged excess relative risk (ERR) dose response at age 70 after exposure at age 30 based on data in the 0- to 2-Gy dose categories. The thick dashed line is a nonparametric smooth of the category-specific estimates and the thin dashed lines are one standard error above or below this smooth. From Preston et al. 2007, with permission.