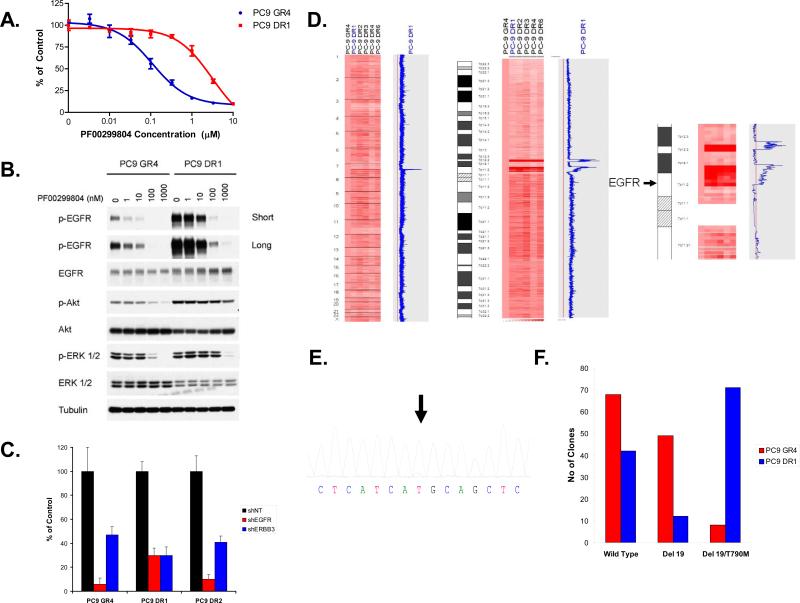
Figure 2.
Generation and characterization of PC9DR cells. A. PC9GR4 and PC9DR cells were treated with PF00299804 at the indicated concentrations, and viable cells were measured after 72 hours of treatment. B. The PC9DR1 cells have higher baseline EGFR phosphorylation than the PC9GR4 cells and require greater concentrations of PF00299804 than PC9GR4 cells to inhibit EGFR, Akt and ERK1/2 phosphorylation. C. The PC9DR cells are EGFR dependent for growth. Control (NT; non-targeting), EGFR or ERBB3-specific shRNAs were introduced into parental or resistant cells and cell viability was measured using an MTS assay 6 days later. Viability is shown relative to cells expressing the control shRNA. Error bars indicate standard deviation. D. The PC9DR cells contain a focal amplification on chromosome 7 encompassing the EGFR locus. The PC9DR clones (right) were compared with the PC9GR4 cells (first column). The blue curve on the right indicates degree of amplification of each SNP from 0 (left) to 8 (right). Left, genome wide view; Center, chromosome 7 view; Right, detailed view of the pericentromeric region of chromosome 7. The genomic location of EGFR is indicated by the arrow. E. Sequence tracing of EGFR exon 20 from PC9DR1 cells demonstrates that the mutant allele (arrow) is the predominant allele. F. EGFR T790M is amplified in cis with delE746_A750 in PC9DR1 cells. RNA isolated from PC9GR4 or DR1 cells was subjected to RT-PCR, the resulting products cloned and the inserts sequenced.

