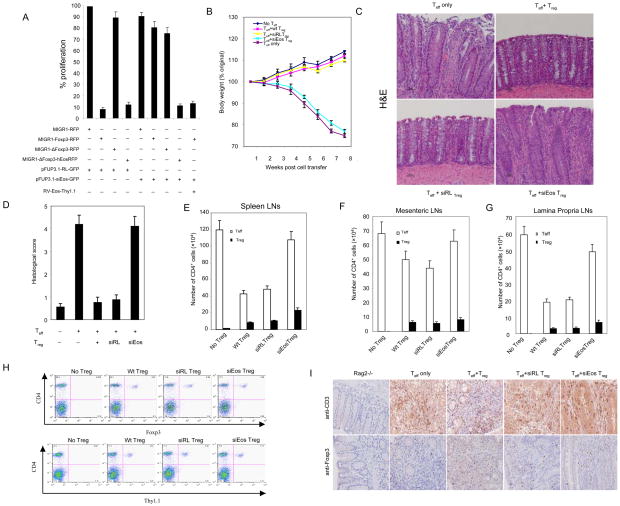
Fig. 4.
Effects of knockdown of Eos on the suppressive activity of Treg cells invitro and in vivo. (A) Knockdown of Eos by siRNA reduces the suppressive activity of Foxp3-transduced naïve T cells. Sorted GFP+RFP+ or GFP+RFP+Thy1.1+ T cells from DO11.10/RAG-2−/− CD4+ cells transduced with the indicated viruses were co-cultured with 2×10⁴ freshly isolated and CFSE labeled DO11.10 CD4+ (Thy1.2+, ratio 1:1) in the presence of OVA peptide and 4×10⁴ APCs (irradiated CD3- cells) for 80h, followed by surface marker, Foxp3 and Ki67 staining. To quantify both frequency and absolute cell number, all cells under each condition were collected. Cell proliferation was determined by CFSE dilution and upregulation of Ki67. The proliferation index was calculated: the absolute number of Ki67+ CFSE diluting Thy1.2+CD4+Foxp3- T responder cells (co-cultured with the indicated Treg cells at 1:1 ratio) were divided by the number of proliferating T responder alone. The results were expressed as the mean ± s.d. for triplicate cultures. (B) Percentage weight change after transfer of the indicated cells demonstrates that co-transfer of siEos transduced Treg cannot suppress weight loss induced by transfer of CD4+CD25− CD62Lhigh Teff into Rag2−/− mice. (C) Representative photomicrography of the distal colon of Rag2−/− mice following T cells transfer. CD4+CD25− CD62Lhigh cells isolated from WT BALB/c were able to induce colitis in BALB/c Rag2−/− recipients (top left). Co-transfer of WT CD4+CD25+ Treg cells (top right) or siRL-transduced Treg (bottom left) was able to prevent colitis. However, siEos-transduced Treg had no effect on colitis (bottom right). Data represent 9–12 mice per group in each panel. (D) Colonic histology scores of experimental mice. Colons were removed from mice 8 weeks after T cells reconstitution and fixed in 10% neutral buffered formalin. Five-micrometer paraffin-embedded sections were cut and stained with haematoxylin and eosin (H&E). Pathology of the colon was evaluated by routine microscopic examination, then scored blindly using a semi-quantitative scale of zero to five (see method section for detail). 9–12 mice were used in each group. (E–G) Analysis of spleen (E), mensenteric LN (F), and lamina propria LN (G) Teff (CD4+Foxp3−) and Treg (CD4+Foxp3+) cell numbers. Foxp3 expression was determined by intracellular staining (eBioscience). (H) Comparable Treg cells are found in Eos deficient and control Treg recipient mice. FACS analysis of spleen and draining mesenteric lymph nodes of mice 8 weeks post-adopt transfer T cells in the model of IBD. Sorted Thy1.1+ Treg cells transduced with siRL or siEos were cotransfered with or without CD4+CD25−CD62Lhi T cells marked as Thy1.1− into Rag2−/− mice. 8 weeks post adoptive transfer, pooled spleen and lymph nodes were stained with APC-CD4 together with FITC-Foxp3 or Thy1.1. Data shown are a representative staining of three independent experiments. (I) Immunohistochemistry (IHC) staining of CD3+ or Foxp3+ T cells in colon tissue. IHC staining of paraffin sections of colon was performed by a peroxidase technique, using the Vectastain Elite ABC kit (Vector Laboratories, Burlingame,CA) and diaminobenzidine substrate kit (Vector). CD3+ T cells were visualized using goat anti-CD3 polyclonal antibodies (Santa Cruz, top panel), and Foxp3+ cells were visualized with rat anti-Foxp3 clone FJK-16 antibody (eBioscience, bottom panel). Haematoxylin serves as a counterstaining (magnification, x 20). Substitution of irrelevant antibodies of the same isotype was used as a control (not shown). The IHC analysis was performed on five mice per group.

