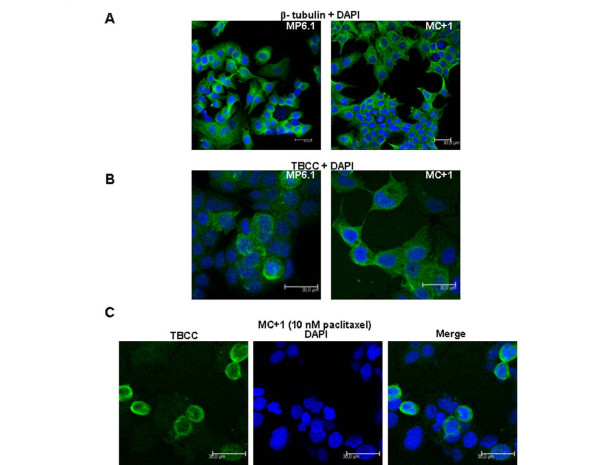
Figure 4.
Localization of TBCC in MC+1 and MP6.1 cells. (A) Representative images of MC+1 and MP6.1 cells after DNA (DAPI, blue) and β-tubulin (FITC, green) staining (B) Representative images of MC+1 and MP6.1 cells after DNA (DAPI, blue) and TBCC (FITC, green) staining (C) Representative images of DNA (DAPI, blue) and TBCC (FITC, green) staining in MC+1 cells exposed 24 hours to 10 nM of paclitaxel.

