Figure 6.
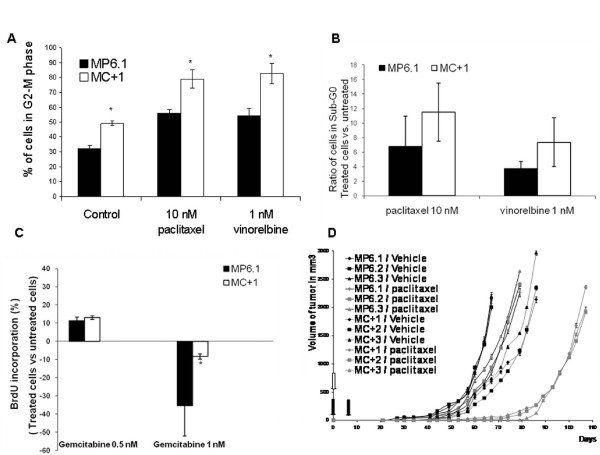
The influence of TBCC protein content on the response to treatment in vitro and in vivo. (A) The Percentage of MC+1 and MP6.1 cells in the G2-M phase of the cell cycle after 24 hours of treatment with 10 nM of paclitaxel and 1 nM of vinorelbine. Results presented are the average values of three experiments. Bars represent standard deviation.*: Values differ significantly from MP6.1 at ≥ 95% confidence level by Student's t-test. (B) The ratio of treated vs. untreated MC+1 and MP6.1 cells in the Sub-G0 phase of the cell cycle after 24 hours of treatment with 10 nM of paclitaxel and 1 nM of vinorelbine. The cell cycle was studied after incubation with propidium iodide. Results presented are the average values of three experiments. Bars represent standard deviation. (C) Proliferative response by BrdU labelling (treated versus untreated cells) after one week exposure to 0.5 and 1 nM of gemcitabine in MC+1 and MP6.1 cells. Results presented are the average values of three experiments.*: Values differ significantly from MP6.1 at ≥ 95% confidence level by Student's t-test. Bars represent standard deviation. (D) Progression of tumors growth and response to paclitaxel measured at 2-3 days interval after subcutaneous injections of each of MC+1, MC+2, MC+3, MP6.1, MP6.2 and MP6.3 cells at day 0 (empty arrow). At day 0 and day 7, paclitaxel was injected intraperitoneally in a dose of 10 mg/kg (black arrow). Results presented are the mean values of the three mice, untreated or treated. Bars represent standard deviation.

