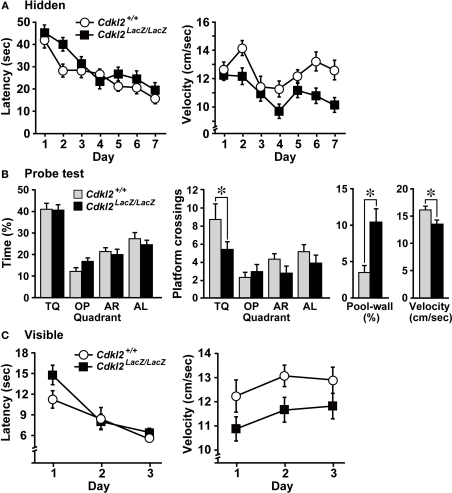
Figure 6.
Morris water maze (MWM). (A) The escape latency (left) and swimming velocity (right) in each session of the hidden-platform test. There was a significant main effect in escape latency among trial sessions based on repeated measures ANOVA (F(6,162) = 20.731, P < 0.001), but the main effect between genotypes was not significant (F(1,27) = 2.465, P = 0.1281). There was a significant main effect between genotypes in the swimming velocity (F(1,27) = 7.351, P = 0.0115). (B) Swimming profiles in the probe test. The percent quadrant search time (left), number of crossings over the platform position in the target quadrant (middle), percent time swimming along the pool-wall, and swimming velocity (right) were analyzed. Cdkl2LacZ/LacZ mice crossed the platform position significantly less often than Cdkl2+/+ mice. Significant main effects were detected among quadrants by ANOVA (F(3,81) = 8.462, P < 0.0001) and between genotypes (F(1,27) = 4.197, P = 0.0500). Significant differences in the percentage of the time swimming along the pool wall (t(27) = 3.379, P = 0.0022) and swimming velocity (t(27) = −3.068, P = 0.0049) were detected between genotypes by unpaired Student's t-test. (C) The escape latency (left) and swimming velocity (right) in each session of the visible-platform test. A significant main effect among trial sessions was detected by repeated measures ANOVA (F(2,54) = 31.254, P < 0.0001), but there was no main effect between genotypes (F(1,27) = 1.217, P = 0.2797). A significant main effect between genotypes was detected in the swimming velocity (F(1,27) = 4.607, P = 0.0410).

