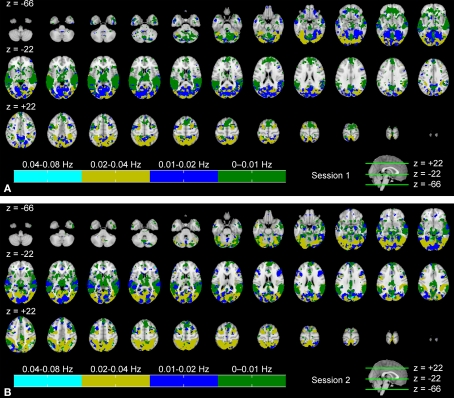
Figure 4.
Frequency ranges showing maximum ISC across: (A) the first scanning session, and (B) the second scanning session. From top left to bottom right, axial slices are shown from z = −66 to 62 mm (in MNI-coordinates) with 4 mm slice thickness. The frequency band showing maximum ISC among all the bands is color-coded. The map was thresholded for p < 0.001 (FDR-corrected over the whole brain).

