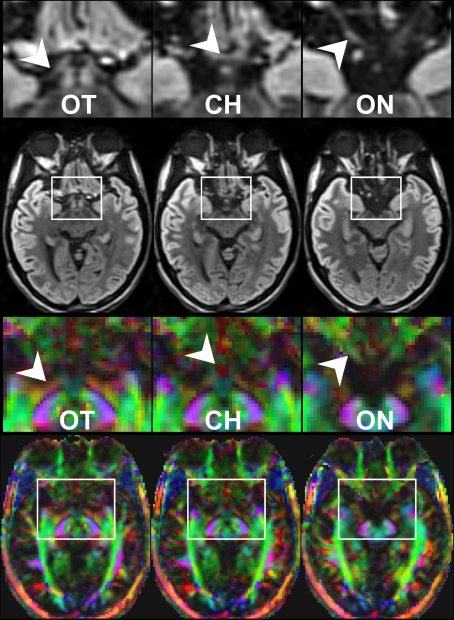
Figure 2.
Contiguous diffusion-weighted STEAM images (averaged across gradient directions) and color-coded FA maps covering the area of the optic nerve and chiasm without susceptibility artifacts at 1.8 mm isotropic spatial resolution (magnified views on top, arrowheads indicate respective areas). OT, optic tract; CH, chiasm; ON, optic nerve. Green = anterior–posterior, blue = superior–inferior, red = right–left.

