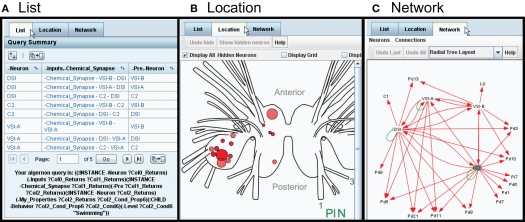
Figure 7.
Three ways to view the results: List, Location, and Network (tabs). (A) The List view shows all parts of the search result as clickable items. (B) The Location view displays the neuron cell bodies on a map of the nervous system. (C) The Network view displays the results in the form of a synaptic wiring diagram. Red arrows represent chemical synapses and green arrows represent electrical connections.

