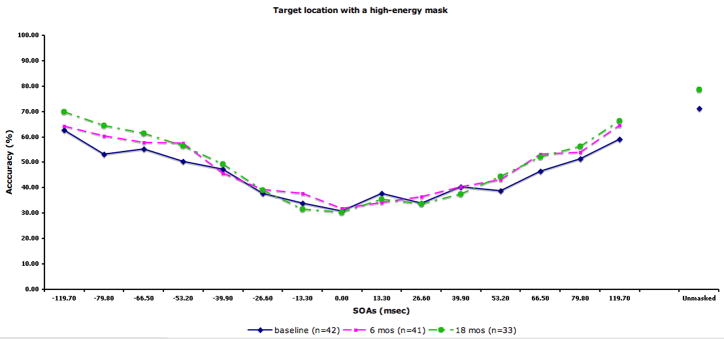
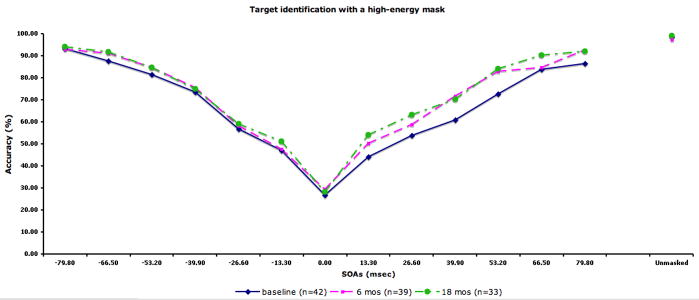
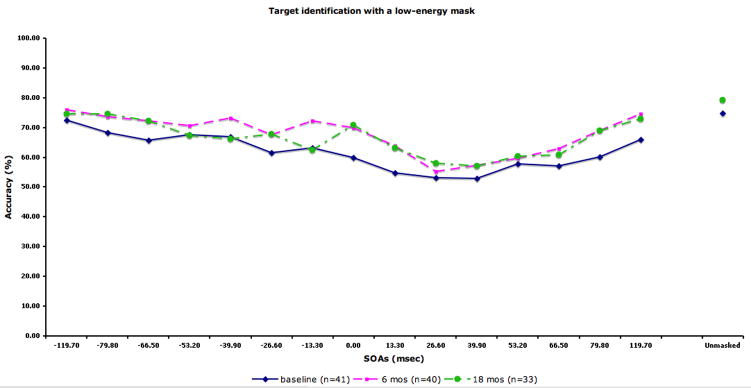
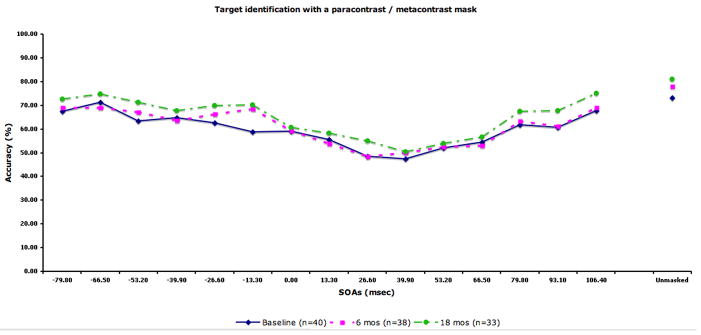
Figure 2.
Performance data by SOA for each masking condition. The solid line indicates performance at baseline. The dotted lines with squares and circles indicate performance at 6-month and 18-month follow-up, respectively. A) Location with a high-energy mask. Chance performance for this condition is 25% accuracy. B) Identification with a high-energy mask. C) Identification with a low-energy mask. D) Identification with paracontrast/metacontrast mask. For the three identification conditions, chance performance is 33% accuracy.


