Figure 6.
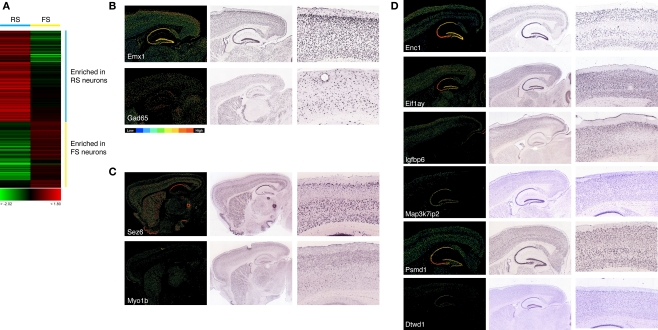
(A) Clustering of transcripts identified by t-test as enriched in either RS or FS cells. Expression is represented by a scale from green (enriched in FS cells) through red (enriched in RS cells). Each row represents expression for a single gene. (B) In situ hybridization patterns for the pyramidal neuron-specific transcript Emx1 and the GABAergic interneuron-specific transcript Gad65. Low power images are shown of mRNA in situ hybridizations of a set of differentially expressed genes on parasagittal sections of the adult mouse brain, from the Allen Brain Atlas (mouse.brain-map.org), along with a high power image of the expression in the somatosensory cortex. In all images the olfactory bulbs are to the left and the cerebellum to the right. For each non-radioactive ISH image, the corresponding Allen Brain Atlas expression analysis image is shown to clarify the relative expression of each gene according to scale of blue (low) to red (high) expression, as illustrated in the attached diagram. (C,D) Confirmation of cell-specific or enriched expression of genes identified by single cell expression profiling as enriched in FS cells (C) or RS cells (D). Genes are as indicated by the gene symbols in each panel. For the RS cell-enriched genes (D), expression can be observed both in some or all cortical layers and also in hippocampal pyramidal cells. FS-enriched genes (C) are expressed in interneurons in the striatum, as well as in the hippocampus and cortex.

