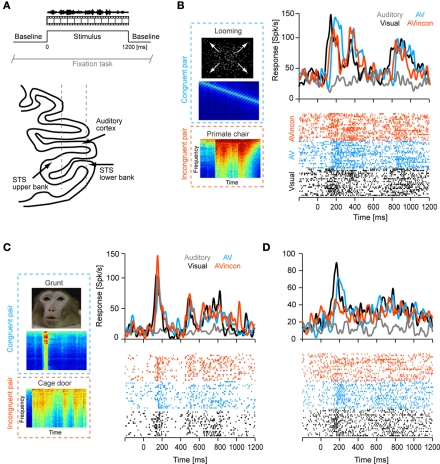
Figure 1.
Example data. (A) The upper panel illustrates the experimental paradigm. Visual, auditory and combined audio-visual stimuli were presented while the animals performed a visual fixation task and were separated by baseline periods (silence, gray screen). The lower panel illustrates the recording approach to the lower bank STS. (B–D) Example responses of three units. Line graphs depict the trial-averaged firing rate (smoothed by a 20-ms Gaussian kernel), lower panels display the spike-raster plots for all except the unimodal auditory condition (dots indicate spikes, lines indicate repeats). The left panels display an example frame of the respective movie and spectrograms for the congruent and incongruent sounds. The three examples each illustrate different patterns of auditory modulation of visual responses and different impact of audio-visual congruency. AV: audio-visual congruent; AVinco: audio-visual incongruent.

