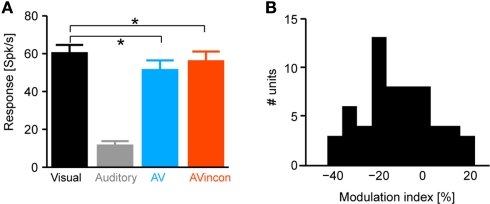
Figure 2.
Modulation of response amplitude. (A) Peak response amplitudes computed using a 80-ms window centered on the peak of the unimodal visual response. Bars indicate the mean and standard error across units. *indicate significant differences, sign-test p < 0.001. The scatter plot displays the same data on a unit by unit basis, displaying the amplitude in each bimodal condition versus the amplitude in the unimodal visual condition. (B) Distribution of the multisensory modulation index across units. The modulation index was defined as the percent difference between the bimodal and unimodal responses divided by their sum (index = 100 × (AV − V)/(AV + V).

