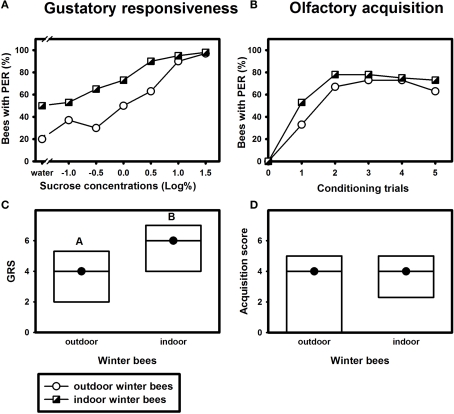
Figure 5.
Gustatory responsiveness and olfactory acquisition of outdoor winter bees and indoor winter bees. (A) Sucrose-concentration response curves of outdoor winter bees and indoor winter bees. The x-axis displays the sucrose concentration offered to the antennae of each bee. The y axis shows the percentage of bees showing the proboscis extension response (PER). (B) Olfactory acquisition curves of outdoor winter bees and indoor winter bees. The x-axis displays the conditioning trials. The y-axis shows the percentage of bees showing conditioned PER. (C) Gustatory response scores (GRS) of outdoor winter bees and indoor winter bees. The x-axis displays the different groups. The y-axis shows median GRS (dots) and 25% (lower line) and 75% (upper line) quartiles. Groups with different letters differ significantly from each other. For statistics see text. (D) Olfactory acquisition scores of outdoor winter bees and indoor winter bees. The x-axis displays the different groups. The y-axis shows median acquisition scores (dots) and 25% (lower line) and 75% (upper line) quartiles. The outdoor winter bees were the same as in Figure 1.

