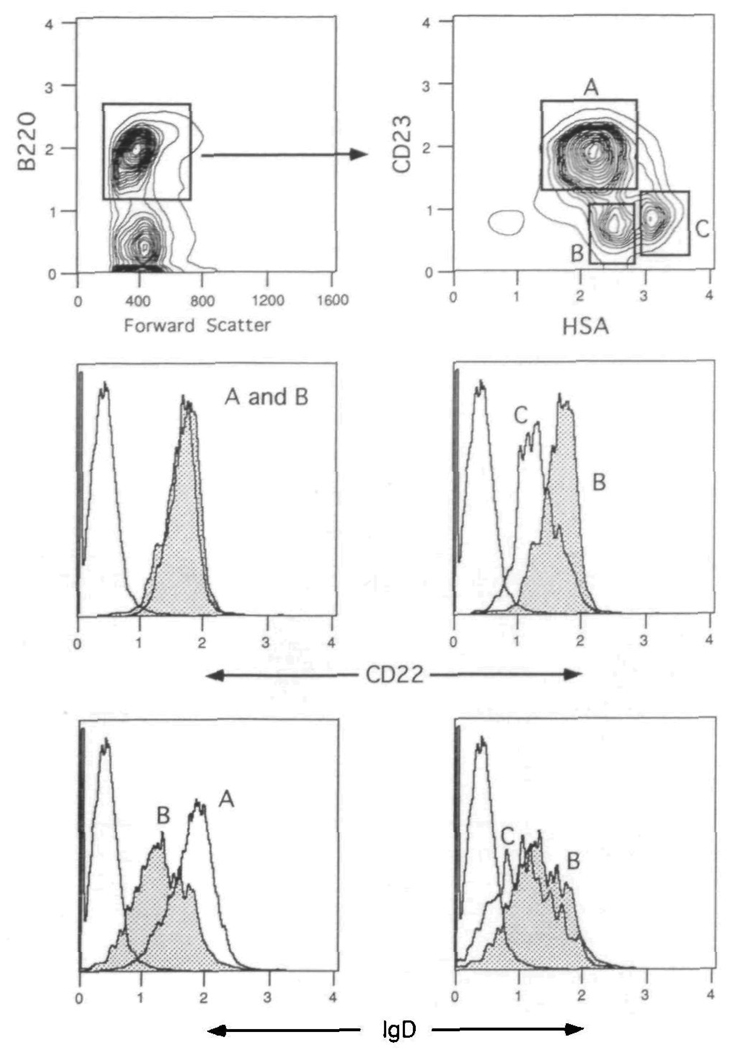
Fig. 4.
CD22 and IgD are differentially expressed on splenic B cell populations Spleen cells were spun through Fico-Lite-LM and stained with Cyanine 5 18–anti-B220, PE–anti-CD23, FITC–anti-HSA and either biotin–anti-CD22 or biotin–anti-lgD plus Texas Red–avidn The upper two contour plots show the gating strategies for the total B220+ compartment (left panel) and CD23 and HSA defined B cell populations (right panel) The lower left panels compare the CD22 and IgD expression levels on follicular (CD23+) and marginal zone (CD23−, HSA++) B cells The lower right panels compare the CD22 and IgD expression levels on marginal zone and immature (CD23−, HSA+++) B cells The isotype control is shown for comparison in the CD22 and IgD histograms. Mean normalized fluorescence intensity values demonstrated that populations B and C expressed 98 6 ± 3 4% (SD) and 57 7 ± 0 8% CD22 levels respectively when compared with population A [(100%) average raw scale value of 3 5 ± 0 9]. One of six experiments.

