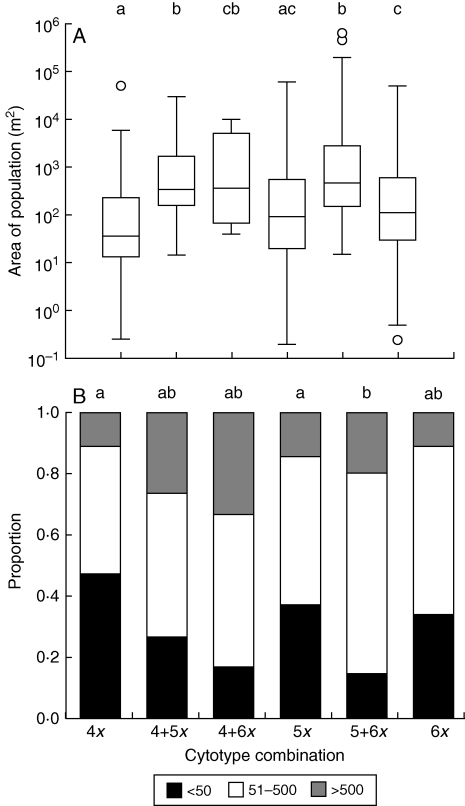
Fig. 2.
Box plot of the area of the population (A) and frequency diagram of population size (B; <50, 51–500, >500 individuals, as indicated) in single- and mixed-ploidy-level populations of Allium oleraceum in the Czech Republic. Mixed populations of 4x + 5x + 6x cytotypes were excluded from the analyses due to small sample size. Note the log-scale of the y-axis in (A). Significant differences in medians between pairs of populations with different ploidy-level combinations (A; Dunn's test with P < 0·05) and in frequencies of population size categories between pairs of populations with different ploidy-level combinations (Cross-tabulation; with P < 0·05) are marked by different letters in rows above the diagrams.

