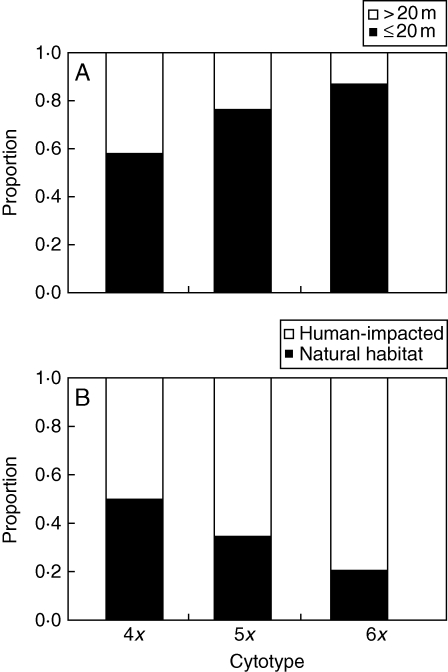
Fig. 4.
(A) Relative frequencies of ploidy levels in relation to the distance of their populations from the nearest arable field (‘Presence of arable land’; distance to the nearest field >20 m or ≤20 m, as indicated). (B) Relative frequencies of ploidy levels in relation to the degree of anthropogenic impact applied on their populations (‘Habitat naturalness’; human-impacted or natural habitat, as indicated).

