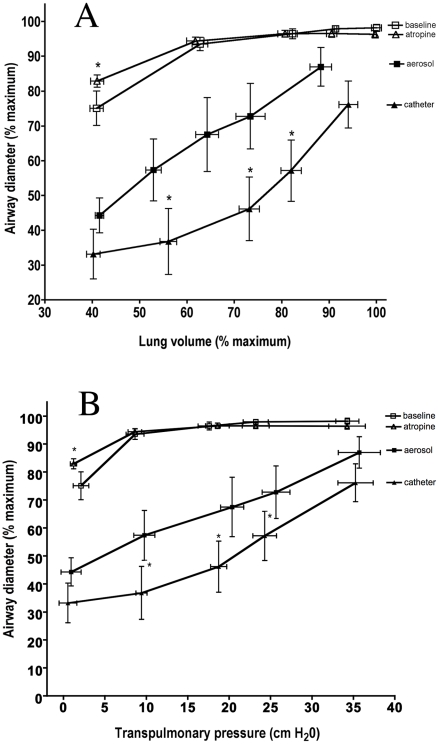
Figure 1.
A: The mean (±SEM) airway diameter (as a percentage of the maximum airway diameter) vs. the mean (±SEM) lung volume (as a percentage of the maximum lung volume) at each airway pressure (0, 12, 25, 32, and 45 cm H2O) under the four conditions: baseline (before aerosol, open squares), atropine (before catheter, open triangles), aerosol histamine challenge (black squares), and individual airway catheter challenge (black triangles). B: The mean (±SEM) airway diameter (as a percentage of the maximum airway diameter) vs. the mean airway pressure under the same four conditions. There were significant differences in airway diameter and lung volume between the aerosol and catheter challenges. At every airway pressure above 0 cm H2O the airways were larger after aerosol challenge than after the local challenge (see text). Also, the aerosol challenge caused a greater stiffening of the lung. (*) At every airway pressure above 0 cm H2O, the lung volumes were larger after the catheter challenge than after the aerosol challenge (see text for p-values).

