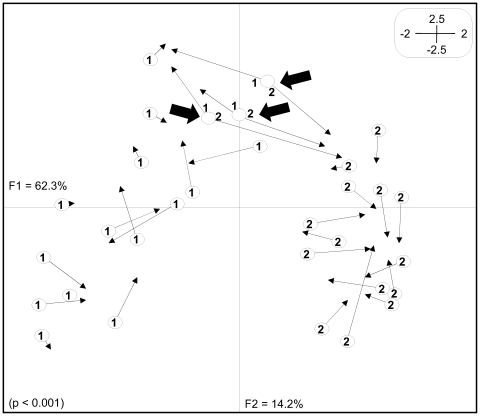
Figure 3. Co-Inertia analysis of Laguncularia racemosa natural populations using genetic and epigenetic data.
The Co-Inertia analysis maximized the covariance of PCAs shown in Figure 2. The significance test of this association was done with 9999 permutations. RS samples are numbered as 1 while SM samples are numbered as 2. Circles (○) correspond to the projection of genetic profiles (EcoRI/MspI) and arrowheads (▸) the projection of epigenetic profiles (EcoRI/HpaII). Black-filled arrows indicate three RS samples that had similar genetic profiles with three SM samples, but divergent epigenetic profiles. F1 and F2 values show the contribution of the two principal components summarizing the total variance of each dataset.

