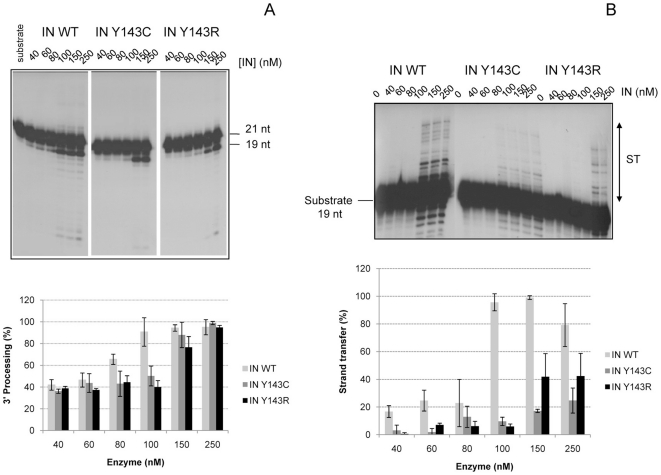
Figure 2. Comparison of IN WT and IN Y143C/R activities in vitro.
2A: 3′-Processing activity of IN WT and IN Y143C/R mutants. Different concentrations of wild-type (IN WT) or mutated HIV-1 integrases were incubated for 1 h at 37°C with the 3′end processing substrate as indicated in method. Samples were analyzed by electrophoresis on 16% acrylamide gels/ 7 M urea in TBE. Top: A typical electrophoresis is shown. Bottom: Quantification of 3′-end processing activity of IN WT and mutants is shown. Data are the average of at least three different experiments. 2B: Strand transfer activity of IN WT and IN Y143C/R mutants. Increasing amounts of WT and mutated IN were incubated with the strand transfer substrate for 1 h at 37°C. A typical experiment is shown (top). The quantification of activities of IN WT and mutants is shown at bottom. Data are the average of at least three different experiments.

